Running reports (managers)
The six report tabs, filters, grouping and CSV export.
For managers & adminsUpdated 31 August 2026
Open Reports from the top bar. Six tabs cover the analytics: Labor, Payroll, Attendance, Shift Feedback, Time Off, Sales.
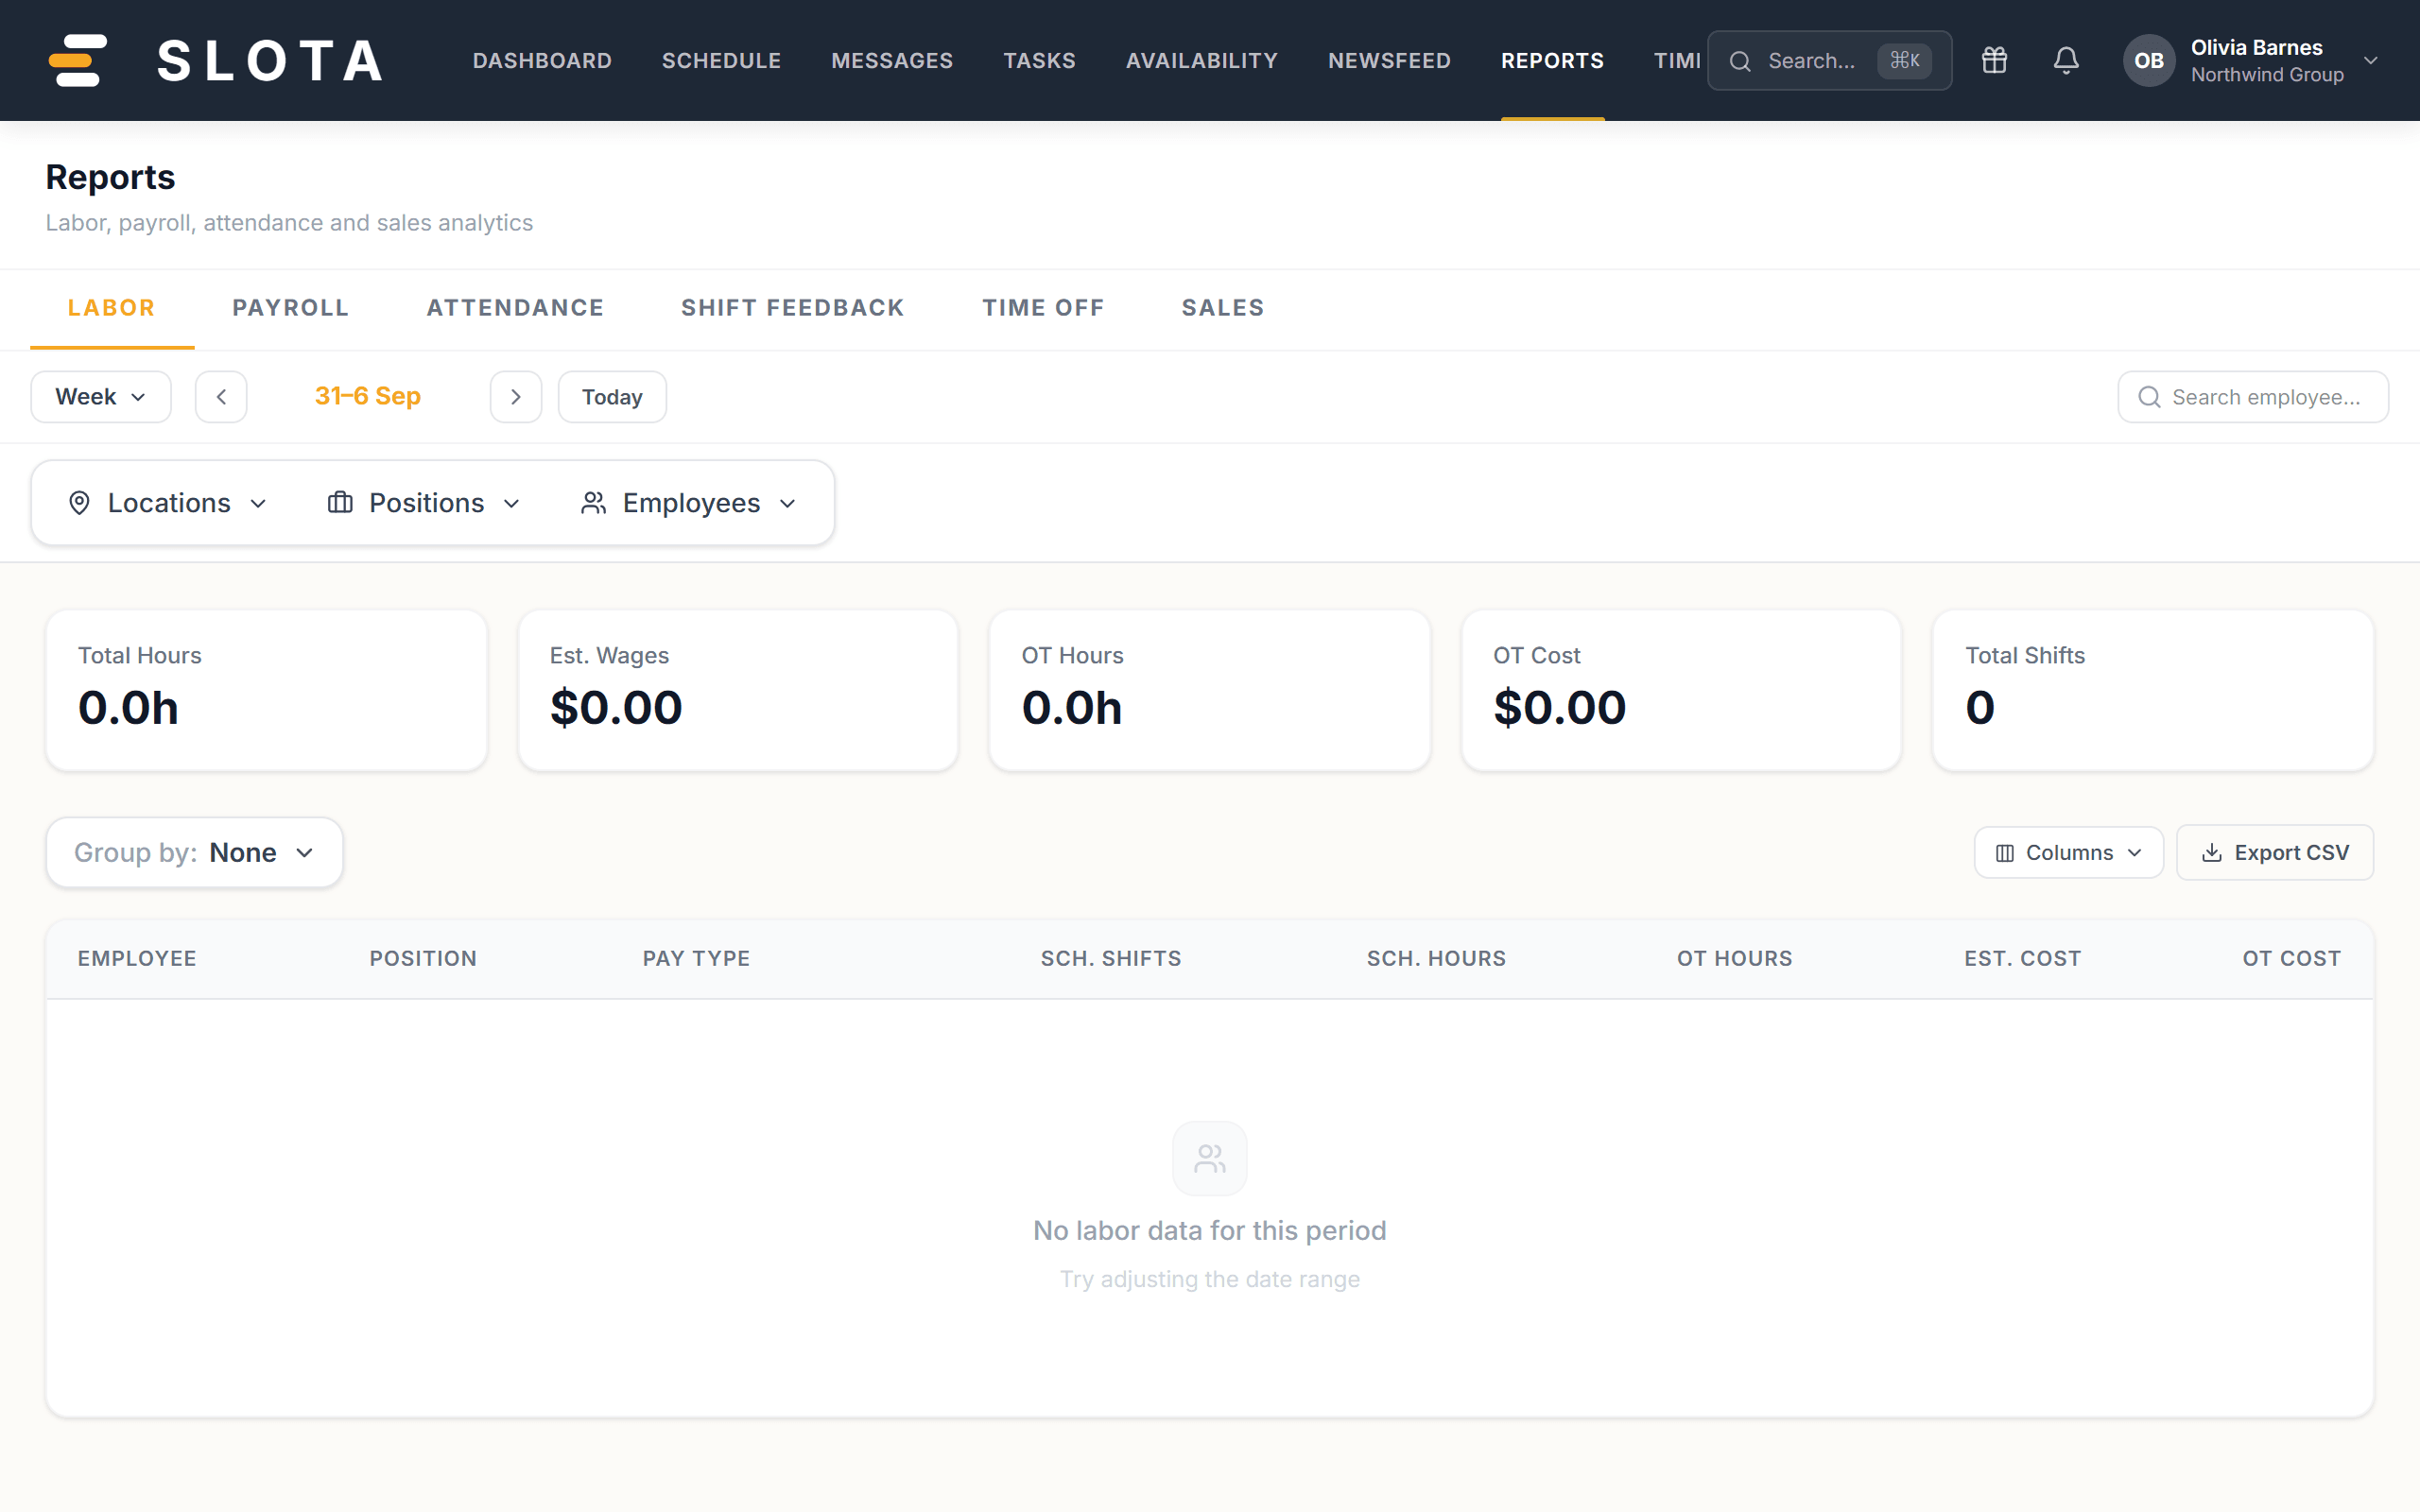
- Pick the tab and the week you want to analyse.
- Summary cards at the top total the period.
- Group by None, Employee, Position or Location to change how rows are bucketed, and use the column picker to choose which columns show.
- Select Export CSV to download the current tab's data.
Attendance, Shift Feedback, Time Off and Sales show data once the week has approved timesheets or sales entries — until then they show a correct empty state, not fake numbers.
Practices
- Approve timesheets before running Payroll or Attendance. Those tabs are built from approved entries; an unapproved week reads as an empty one.
- Export the CSV when you need the number to survive. The on-screen view moves as data changes; the export is a snapshot.
- Group by Position when you are asking "what does this job cost", and by Employee when you are asking "what does this person cost". They answer different questions and disagreeing totals usually means you asked the wrong one.